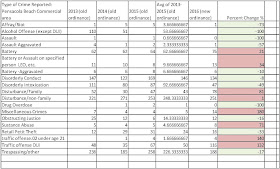
The data provided by the sheriff's office is limited to a four year look, with the first three years (2013-2015) being three years' worth of data that was compiled prior to enactment of the open container ban at Quietwater beach.
The 2016 data is for the period after the alcohol ban on the boardwalk was enacted.
As I stated in previous blog posts on this matter--I'm not a fan of limiting citizens' rights, particularly on a county-owned specialty center that upon which, under Florida statutes, open containers of alcohol are allowed and subject to regulation by the county.
As I have stated at the meetings and also on blog posts, I need to see compelling data that supports continuing this prohibition before I will support extending this ordinance. Otherwise, in my estimation, it should sunset and efforts should be concentrated on enforcing existing ordinances and punishing those who violate law--instead of throwing a huge wet-blanket ordinance over EVERY citizen (the vast majority of whom obey the law) by prohibiting open containers on our specialty center, the Quietwater beach boardwalk.
Our neighbor to the East, Destin, has a specialty center that permits open containers. The South Harbor Festive Marketplace is a HUGE success over in Destin. How is it that they can manage their specialty center and allow open containers while maintaining a friendly atmosphere---but we can't?
Regardless, that question is a rhetorical one. The data, which is what should matter, does not point to this ordinance as the panacea that is lowering crime. Several important categories have shown huge percentage increases since enactment of the open container ordinance. Notably--DUIs are up 132% beach-wide and 75% at Quietwater beach alone since enactment of this ordinance. Battery and Disturbance (family and non-family) infractions are way up as well since this ordinance was enacted. Careful consideration must be given the important decision that is coming up on this matter, as we should not rush to continue this prohibition if this exacerbates the instances of criminal activity on the beach...
The data that I have illuminated in figures 1 and 2 below, created by averaging the infractions in the three-year, pre-open container ordinance and comparing this average in every crime category to the 2016 data (post ordinance) numbers and then calculating the change in each category--shows some alarming trends.....
 |
| Figure 1: a four year analysis of crime statistics from the Pensacola Beach commercial core (data provided by Escambia Sheriff's Office) |
 |
| Figure 2: a four year analysis of crime statistics from Escambia County's Quietwater Beach specialty center (data provided by Escambia Sheriff's Office) |
No comments:
Post a Comment
Comments turned off
Note: Only a member of this blog may post a comment.